|
||||
Measuring ParabolasAs we have explained in previous pages of our Optical Testing section, both the Foucault, or knife-edge, test and the Ronchi test are null tests for spherical mirrors. How then do we measure the complex shape of a parabolic mirror using such test equipment? This page will provide you with a basic understanding of the process; we do not attempt to go into the detailed mathematics, which today are all handled by free computer data reduction software. If your want to understand the mathematics, we suggest you [Texereau84] as a good place to start. These measurements and the subsequent data reduction allow us to produce quantitative results for the shape and quality of a mirror.
The following is an excerpt from the talk A Introduction to Foucault Testing and Foucault Testers
given at the 2002 Stellafane Convention by Ken Slater of the Springfield Telescope Makers.
A Spherical Approximation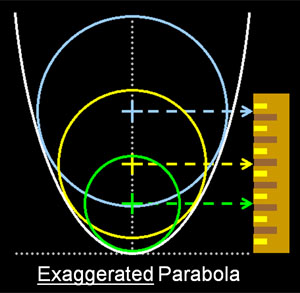 Figure 1: Using Spherical Zones to approximate a Parabolic Surface. The key concept in measuring a complex shaped mirror surface is that we can define a set of annular (concentric) zones on the mirror surface, and use the information on the size and position of the zones to compute the surface profile of the mirror. Let us review this step by step, as well as the assumptions we make in doing this. Our first assumption is that our mirror surface is a smooth, continuous surface with no sharp discontinuities. Any well polished out mirror should satisfy this assumption. This assumption allows us to test for any surface shape on our mirror that is smooth and continuous: parabola, hyperbola, prolate & oblate ellipsoids, and various other surface features such as hills, valleys and rings. A further assumption is that the mirror has no astigmatism; that is it is rotationally symmetric about the optical axis. If you have been careful in your work and 'walked around the barrel' you should not have astigmatism, but it can happen. You can detect this problem by testing several different diameters of your mirror by rotating it on the test stand (usually done with 0°, 45° and 90° rotations.) Referring to Figure 1, we see a very exaggerated parabola in white, and three circles nested inside it. Note that the small green circle is tangent to the parabola at its center; the yellow circle is tangent a bit further out, and the large blue circle is tangent to the parabola furthest from the center. You can see that at and near the areas where the circles are tangent to the parabola, the shape of the surface is nearly spherical - it is so close, in fact, that we can get a spherical null of that surface in the tester! This is the key to testing and measuring complex mirror shapes like parabolas: finding the null of a specific set of zones (think of zones as tangents of nested circles) and measuring their positions. Measuring the Zones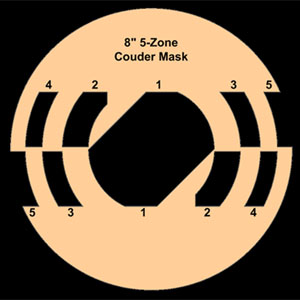 Figure 2: 8-inch, 5-Zone Couder Mask for zonal null testing. The zones we measure must be of known size and shape. There are many ways to delineate the mirror into zones; we prefer to use a formula that makes each zone of equal optical area (which results in the outer zones being thinner than the inners zones). You can calculate equal area zones using our Mirror Zone Calculator. Three zones are good for initial testing of 8-inch and under mirrors; final testing should use at least five zones. Larger mirror should use more zones. Figure 2 illustrates a typical Couder Mask, in which the calculated zones are cut out as windows in the mask (A manila file folder is good mask material). This is placed directly in front of the mirror for zonal testing to aid in isolating the zone to null (If you are using a test stand like ours, just rest the mask on the two pins that are holding the mirror). While the zone radii are calculated and carefully cut on the mask, the window height is not critical can be made any convenient size. With the mask in place, each zone is successively nulled in the tester, and the relative offset (from other zones) of the tester towards or away from the mirror is measured and recorded. This is illustrated in cartoon fashion in Figure 1, with the center of each circle having an arrow pointing at a ruler. To be clear, we measure the difference in zonal null positions, not the absolute radius of curvature of each zone. Calculating the Mirror Surface ProfileWe will not go into the mathematics of this calculation, rather we will review the required data and show you how one data reduction program we like to use transforms this into a Mirror Surface Profile and quality metrics for the mirror under test. We like to use FigureXP (A download link to this free program can be found on our Foucault Data Reduction Software Page). Basic Information: The program needs to know your mirror diameter, the units you would like to work in (inches or millimeters) and the desired shape (deformation) of your surface expressed as a conic constant (0 for spherical, -1 for parabolic, others for the family of hyperbolas and ellipses). The program needs to know the radius of curvature of the central zone, which after nulling that zone, you can measure with a tape measure (Note that this measurement does not have to be highly accurate, but the better it is, the faster the program will figure out the figure of your mirror; One quarter inch is good enough). Zone Information: You need to tell the program how many zones your are using and the radius of each mask zone (either the inner/outer zone radii which we prefer using, or the zone center radius). 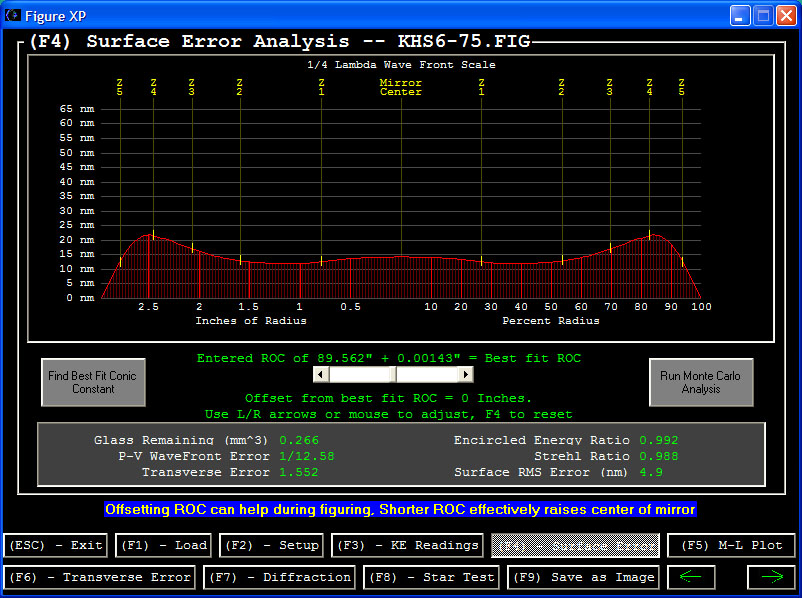 Figure 3: Surface Error Analysis screen from FigureXP (Click to Enlarge) Tester Offset Measurements: Also called Knife Edge readings, these are the relative measurements between zone nulls. They do not have to be normalized (i.e., the measurement of the first zone, usually the center zone, does not have to be zero). Many programs allow you to input several sets of measurements which will be averaged. Since nulling zones can be difficult and repeatability to the same measurement for the same zone rarely occurs, averaging is a good strategy to use for final testing to get a better result. Also, if you see that one or several data points are very different from the others, you might want to discard that data set and take another set of measurements. The Results: Figure 3 shows one of the result screens from FigureXP. The red surface error profile shows how the mirror under test varies from the desired shape -- a perfect mirror would be a thin flat line at zero. The actual zonal measurements are highlighted as yellow ticks on this surface. The assumption of smoothness creates the slight central rise, but since the data points are widely spaced here, it might or might not be there. With the closer spacing of the other measurement points, we can be pretty certain this is a good representation of the surface, except perhaps at the edge, where the rapid change of the sharp drop off might have a slightly different shape if more measurements were taken (not to suggest that this be done, it is difficult to measure edge zones, and we have enough information to work out a figuring plan). In the lower gray panel, there are a number of mirror quality indicators which will be discussed on our Mirror Quality page. Notice the purple highlighted text near the bottom, this program also has the option to adjust your input Radius of Curvature to find the best fit parabola, which can often save you time and work if you don't need to hit an exact focal length (most beginners can tolerate a small shift in focal length). The first green line of text indicates this option is on, and the entered Radius of Curvature was lengthened by 0.00143" to get the best fit. SummaryMeasuring the offsets of a set of spherical nulls in defined zones allows data reduction software to calculate the surface profile and quality of a mirror. While the mathematics may be complicated for many, the concept of using a series of nested spherical zones to approximate complex surface shapes is not difficult to grasp and the required testing techniques can be mastered by all. |
||||
|
Back to the ATM Index Page |
||||